
Instant charts
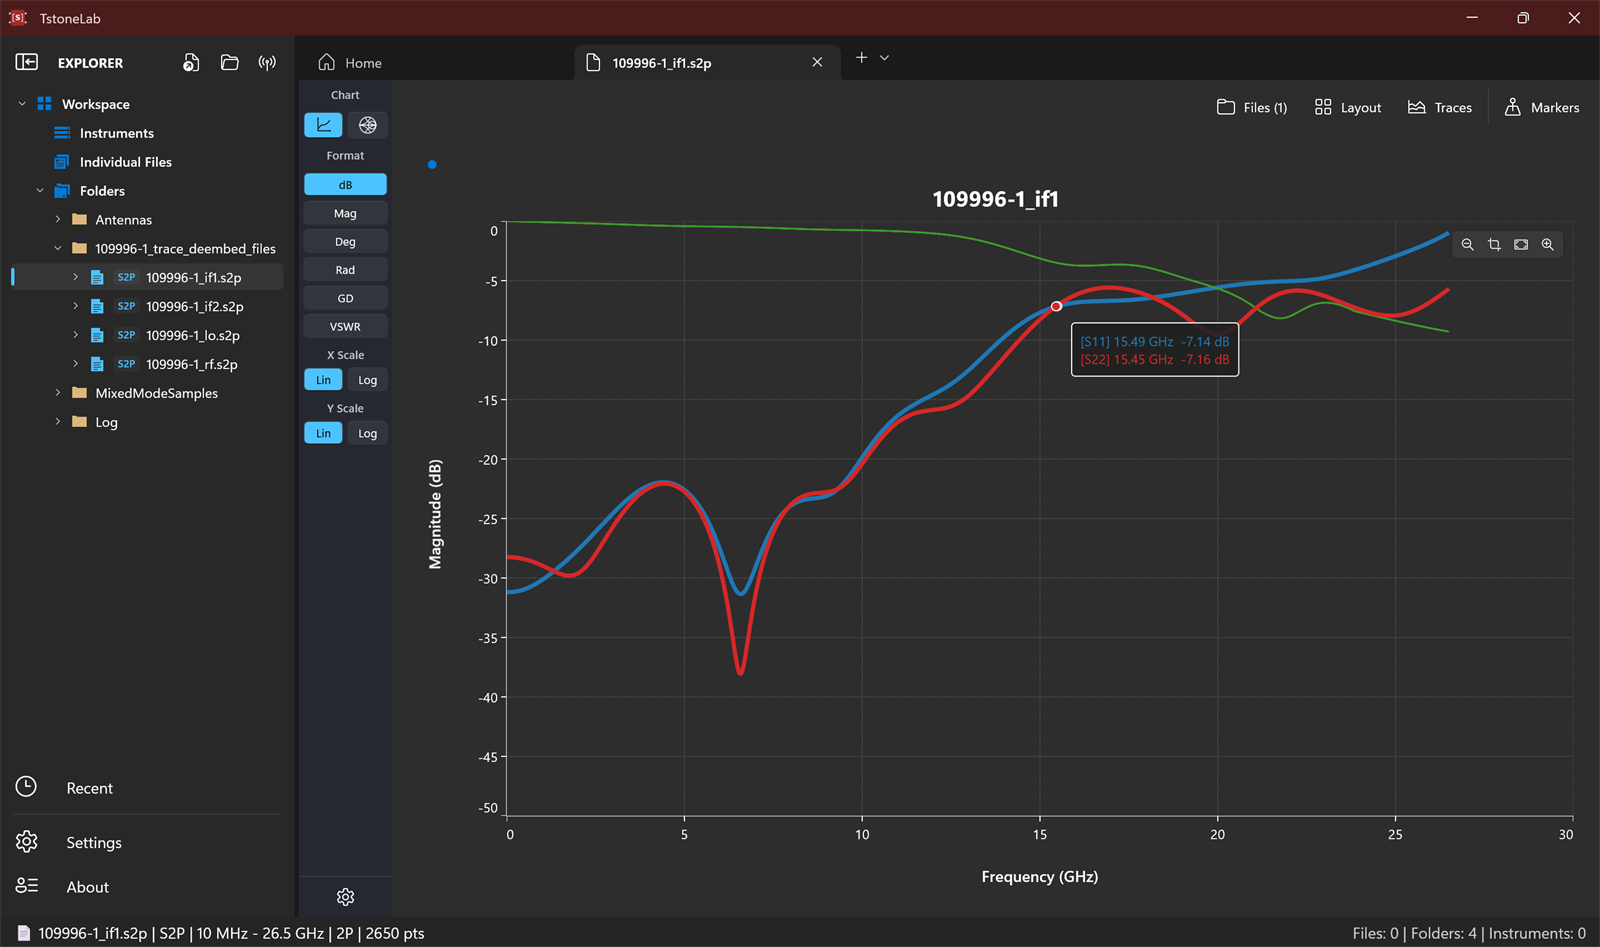
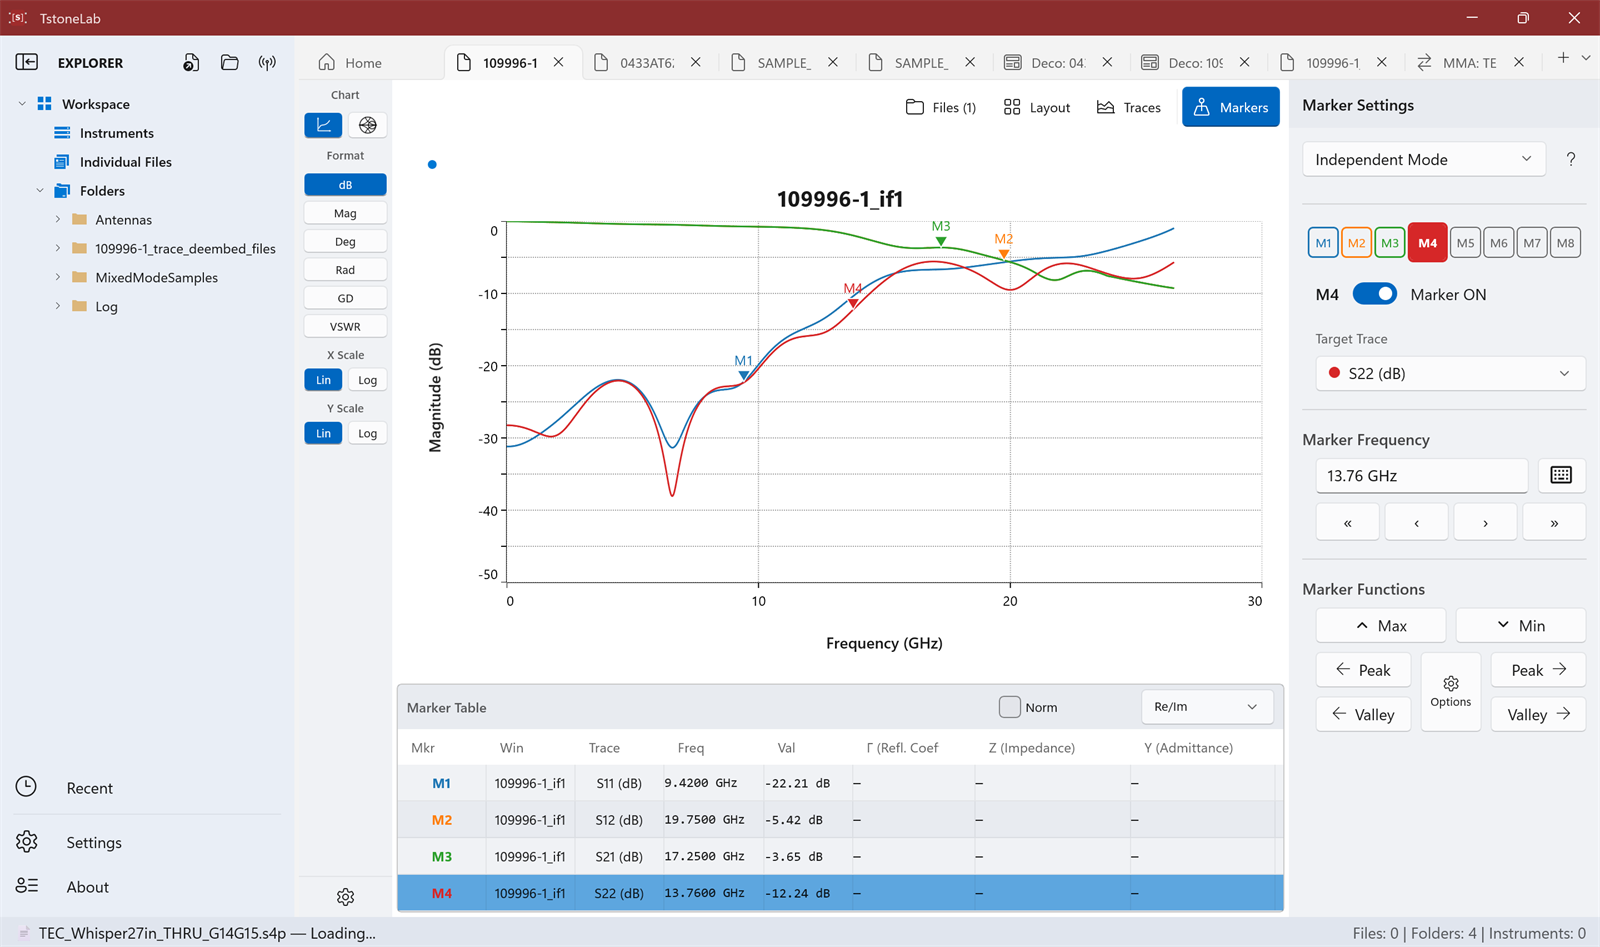
Drop in a Touchstone file and get magnitude, phase, group delay, or VSWR in seconds — with markers, peak search, and hover readouts.
For RF engineers · Windows
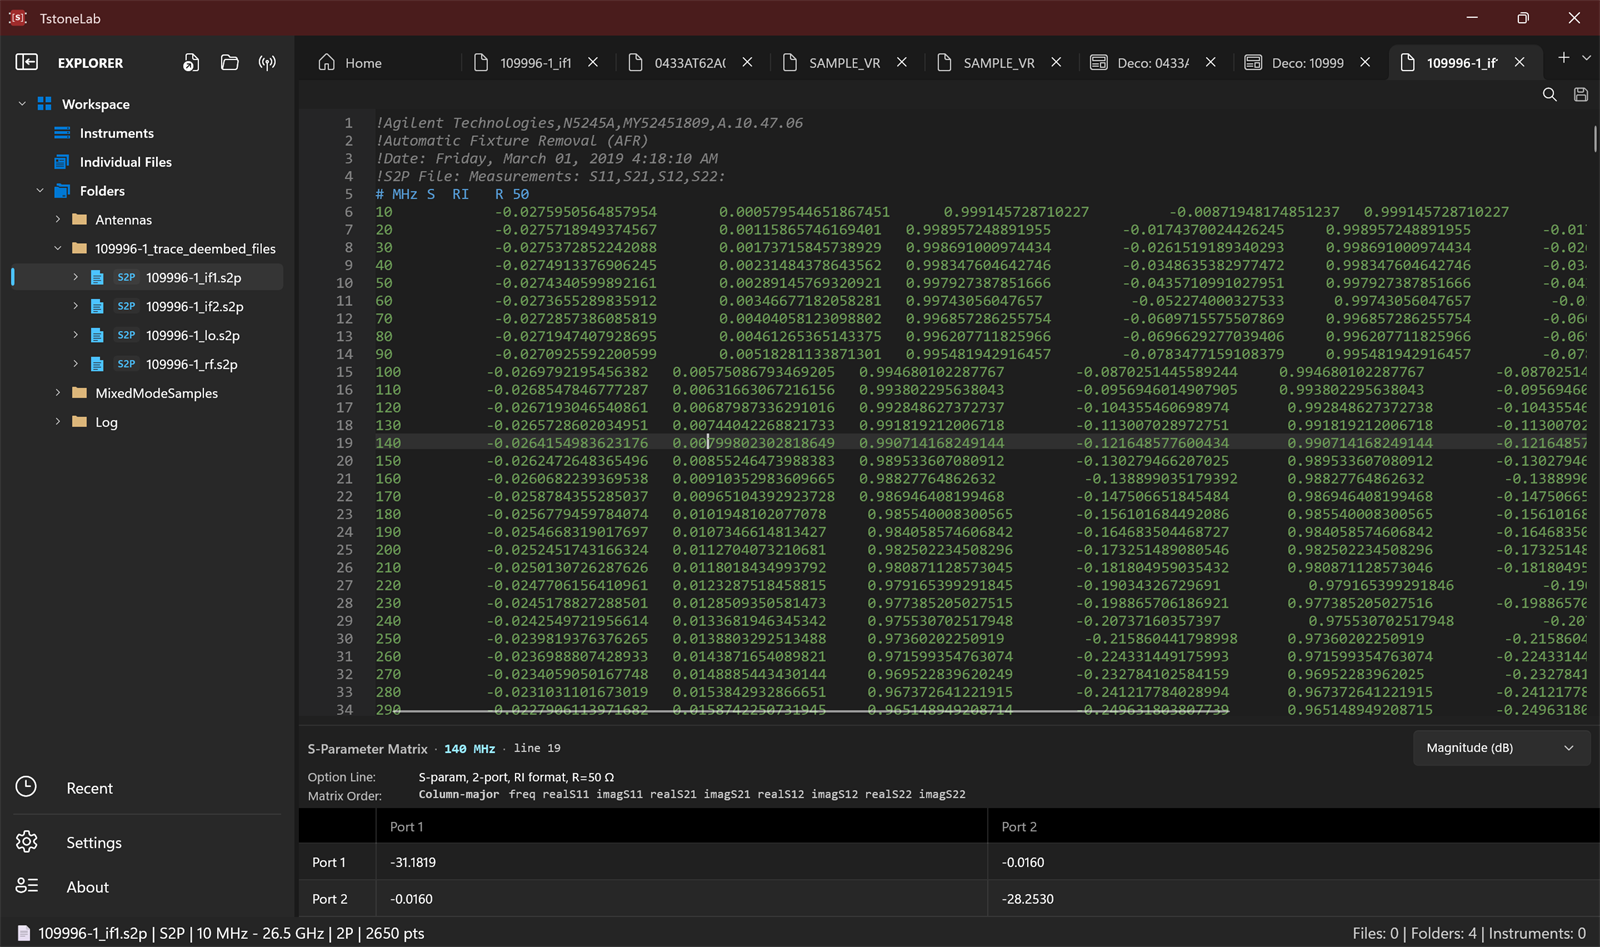
TstoneLab opens Touchstone files instantly — plot, probe, and compare S‑parameters across files and panes, with the charts RF work actually needs.
.s1p.s2p.s4p.snpdrag in, chart out

What it does
Drop in a Touchstone file and get magnitude, phase, group delay, or VSWR in seconds — with markers, peak search, and hover readouts.
Overlay any number of Touchstone files on a single chart to compare runs and revisions, split them across multi-chart layouts, or open a whole folder at once.
Read Γ, impedance, and admittance right off the Smith chart, and drag the adjustable VSWR circle to check matching against your target.
Working with differential pairs? Convert 4-port single-ended data to differential and common-mode S‑parameters (Sdd, Scc, and the cross terms) in one step.
Flip frequency data into TDR/TDT views to locate discontinuities along the line, and use Port Mapper to renumber ports or pull out subsets when the file order doesn't match the bench.
DecoChart turns working plots into publication- and datasheet-grade figures — style templates, logo overlay, and one-click copy or PNG export.
Screenshots


Built-in MCP server
MCP (Model Context Protocol) is the open standard that lets AI assistants use desktop apps as tools. TstoneLab ships with an MCP server built in — connect Claude or any MCP client once, and your Touchstone workspace becomes something you can ask questions in plain language.
Works with Claude and other MCP-compatible assistants · Read the setup guide
“Screen every file in the Antennas folder against S11 ≤ −10 dB up to 6 GHz.”
Claude · via MCPChecked 14 files — 12 pass. filter_rev2.s2p fails at 5.86 GHz (−8.4 dB) and diplexer_a.s2p at 5.91 GHz (−9.7 dB).
“Summarize coupler_demo.s4p.”
Claude · via MCP4 ports, 10 MHz – 26.5 GHz, 2650 points. Worst insertion loss is 3.1 dB near 24.8 GHz; return loss stays below −12 dB across the band.
Illustrative conversation — answers come from your actual files.
Beyond the viewer
Connect VISA-compatible instruments and measure S‑parameters straight into the app over SCPI — the chart opens itself when the data lands. A dedicated SCPI editor handles custom command sequences.
No data yet? Draw the network on a schematic canvas — R, L, C, transmission lines, stubs, quarter-wave transformers, even embedded Touchstone blocks — sweep it, and chart the result on Cartesian or Smith plots.

Free · Runs on Windows 10 and 11 · Distributed through the Microsoft Store